有两种方法,runtime/pprof 和 net/http/pprof ,后者封装了前者
这里介绍前者的使用流程。
引入:
1import "runtime/pprof"
把监控数据写入文件,检测 cpu 添加在main 开头,检测内存放在结尾:
1
2
3
4
5
6
7
8
9
10
11
12
13
14
15
16
17
18
func main(){
    f, err := os.Create("cpu_profile")
    if err != nil {
        log.Fatal(err)
    }
    pprof.StartCPUProfile(f)
    defer pprof.StopCPUProfile()

    // your code

    //
    f2, err := os.Create("mem_profile")
    pprof.WriteHeapProfile(f2)
    f2.Close()

    pprof.StopCPUProfile()
    f.Close()
}
编译、运行程序
1
2
go build main.go -o myapp
./myapp
查看profile 的命令 go tool pprof main profile
1
2
go tool pprof myapp cpu_profile
go tool pprof myapp mem_profile
另外需要安装一个辅助工具 graphviz,我是用源码安装
1
2
3
./configure
make
make install
查看命令示例:
1
2
3
4
5
6
7
8
9
10
11
12
13
14
15
16
17
18
19
20
21
22
23
24
25
26
27
28
29
30
31
32
33
34
35
36
$ go tool pprof myapp cpu_profile
File: myapp
Type: cpu
Time: Dec 14, 2017 at 8:46am (CST)
Duration: 7.20mins, Total samples = 5.90mins (81.99%)
Entering interactive mode (type "help" for commands, "o" for options)
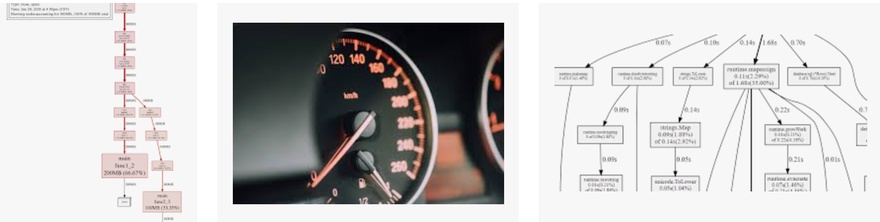
(pprof) web
(pprof) top
Showing nodes accounting for 348.26s, 98.33% of 354.19s total
Dropped 225 nodes (cum <= 1.77s)
Showing top 10 nodes out of 40
flat flat% sum% cum cum%
209.54s 59.16% 59.16% 209.54s 59.16% syscall.Syscall /usr/local/go/src/syscall/asm_darwin_amd64.s
69.88s 19.73% 78.89% 69.88s 19.73% time.now /usr/local/go/src/runtime/sys_darwin_amd64.s
38.17s 10.78% 89.67% 38.19s 10.78% syscall.Syscall6 /usr/local/go/src/syscall/asm_darwin_amd64.s
22.08s 6.23% 95.90% 22.08s 6.23% runtime.memmove /usr/local/go/src/runtime/memmove_amd64.s
6.14s 1.73% 97.63% 6.14s 1.73% runtime.kevent /usr/local/go/src/runtime/sys_darwin_amd64.s
2.34s 0.66% 98.29% 2.34s 0.66% runtime.mach_semaphore_signal /usr/local/go/src/runtime/sys_darwin_amd64.s
0.05s 0.014% 98.31% 7.82s 2.21% runtime.schedule /usr/local/go/src/runtime/proc.go
0.04s 0.011% 98.32% 6.65s 1.88% runtime.findrunnable /usr/local/go/src/runtime/proc.go
0.01s 0.0028% 98.33% 7.09s 2.00% runtime.mcall /usr/local/go/src/runtime/asm_amd64.s
(pprof) list main.main
Total: 5.90mins
ROUTINE ======================== main.main in /Users/tmp/testp.go
......
. 6.36s 162: randCid := random(1, categoryNum)
(pprof) peek random
Showing nodes accounting for 354.19s, 100% of 354.19s total
----------------------------------------------------------+-------------
flat flat% sum% cum cum% calls calls% + context
----------------------------------------------------------+-------------
6.79s 100% | main.main /Users/tmp/testp.go
0 0% 0% 6.79s 1.92% | main.random /Users/tmp/testp.go
6.78s 99.85% | time.Now /usr/local/go/src/time/time.go
0.01s 0.15% | math/rand.Seed /usr/local/go/src/math/rand/rand.go
上面用到四个命令:
1
2
3
4
(pprof) web   --- 生成svg 文件,可用浏览器查看
(pprof) top  --- 看看消耗top
(pprof) list main.main --- 查看函数时间消耗
(pprof) peek random --- 查看某个函数,这里查看 random 函数
也可以使用 pprof 工具分析在线服务的数据,前提是在服务里引入_ "net/http/pprof"
1
2
3
4
go tool pprof http://localhost:6060/debug/pprof/heap
go tool pprof http://localhost:6060/debug/pprof/goroutine
go tool pprof http://localhost:6060/debug/pprof/profile
go tool pprof http://localhost:6060/debug/pprof/block
本文网址: https://golangnote.com/topic/217.html 转摘请注明来源